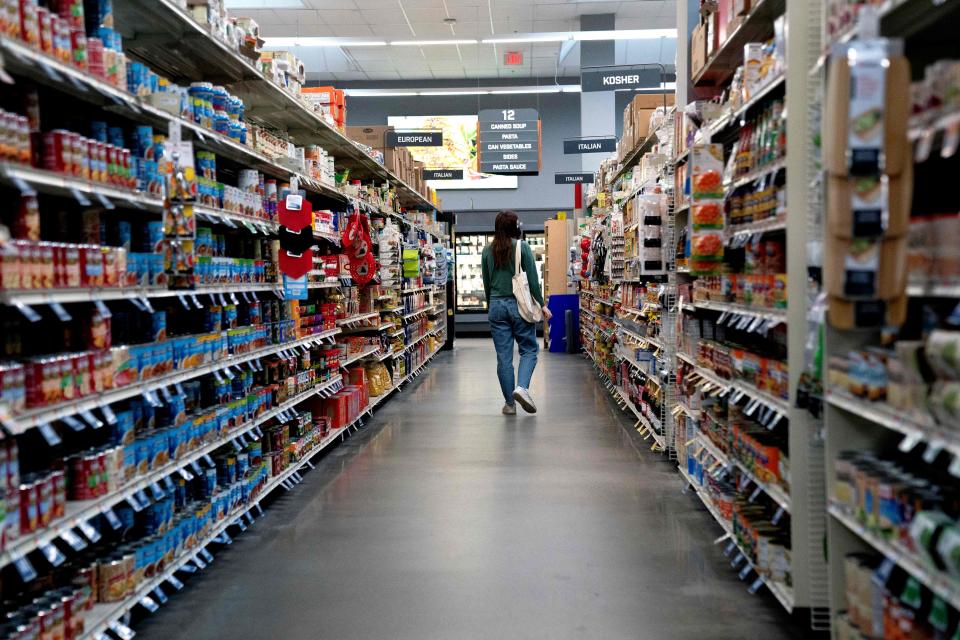
Food inflation: As grocery prices continue to soar, see which states, cities have it worse

Rising food prices have slowed down compared to the previous few years, but Americans are still feeling the pain of high prices.
Between July 2023 and July 2024, food prices rose 2.2% - down from 4.9% the previous 12-month period, according to new data from the U.S. Bureau of Labor Statistics. But even with cooling food inflation, grocery prices are up about 25% compared to 2019, according to the bureau.
Heightened prices are eroding consumers' living standards, Joanne Hsu, director of the University of Michigan’s Surveys of Consumers, told USA TODAY in June.
“A lot of consumers, they'll tell us that things are painful specifically because of continued high prices,” Hsu said. “I think that is understandable. There are a lot of things that remain quite expensive for consumers and are a higher proportion of their monthly budgets than they were before.”
Changing prices of common grocery store items provides insight into how food inflation has changed in different states and metro areas. Here's where prices have risen the most:

Where are Americans experiencing rising food inflation?
Datasembly, a website that provides up-to-date data on different brands, tracked how grocery prices have changed across the U.S. in the previous 12 months. Datasembly's Grocery Price Index measures weekly changes in grocery prices using data from over 150,000 stores and over 200 retail banners.
The company tracked price changes for the following food categories: snacks, baked goods, beverages, baby food, baby formula, cereal, cookies, crackers, meal solutions, grains/beans/pasta, baking, seasonings, sauces, candy, fruits, vegetables, condiments, dressings and pet food.
Vermont experienced the largest increase in grocery prices, followed by Hawaii and Oklahoma, according to the Grocery Price Index.
Population density can influence pricing strategy. Prices are likely to differ in urban areas compared with rural areas due to issues related to the supply chain and levels of demand, Consumer Affairs reported. Nationwide, average grocery prices in these categories increased less than 2% year-over-year.
States with the largest grocery price increases
In the past 12 months, grocery prices have increased the most for the following states:
Vermont: 3.1% increase year-over-year
Hawaii: 2.6% increase year-over-year
Oklahoma: 2.1% year-over-year
New Mexico: 2.1% year-over-year
Alabama: 2.1% year-over-year
North Dakota: 2% year-over-year
Pennsylvania: 2% year-over-year
Maine: 1.9% year-over-year
New Hampshire: 1.9% year-over-year
Delaware: 1.9% year-over-year
Which cities experienced the largest grocery price increases?
The following metro areas experienced the largest increases in grocery prices over the past 12 months:
Oahu, Hawaii: 2.7% increase year-over-year
San Antonio, Texas: 2.2% increase year-over-year
West Texas: 2.1% year-over-year
Oklahoma City: 2.1% year-over-year
Greenville, South Carolina: 2.1% year-over-year
New Orleans, Louisiana: 2.1% year-over-year
Birmingham, Alabama: 2.1% year-over-year
Syracuse, New York: 2% year-over-year
Miami, Florida: 1.9% year-over-year
Milwaukee, Wisconsin: 1.9% year-over-year
Contributing: Bailey Schulz, USA TODAY
This article originally appeared on USA TODAY: Food inflation: Which states, cities have been hit hardest?
Solve the daily Crossword

